
Lately there have been numerous claims of a coming sea level rise catastrophe resulting from the “climate crisis” supposedly driven by ever increasing fossil fuel related emissions of carbon dioxide. The claims include coastal sea levels rising a meter or more over coming decades and inundating many coastal cities. I decided to examine the actual coastal sea level measurements to see what they show regarding these extraordinary claims. What I found is that coastal sea level measurements indicate that the long-term absolute coastal sea level rise is not accelerating and is not alarming. In fact, it is consistent with what humans have dealt with over the last 150 years and nothing worse.
Sea level changes are very important to human activities and interests at coastal locations, especially in populated areas. However, what happens in the middle of oceans is of little consequence in this regard. Thus, I have focused on coastal measurements. Sea level monitoring at some coastal locations began over 100 years ago. From these longer periods of record, coastal sea level trends can be evaluated over time and compared among locations.
First, there are several important factors to consider for coastal sea level measurements. Most importantly, the land can rise or fall over time relative to the center of the earth and this change can significantly affect the relative sea level change measured at a given location over time. A lesser, but sometimes important effect can occur from change in elevation of the measurement station relative to the overall nearby land surface, such as from a heavy concrete dock slowly sinking into the surrounding mud over time for instance. Also, measurement methods vary from station to station and over time which can introduce artificial differences. Another factor is that sea level at some locations is much more variable over time because of tides and/or storm surge and associated variations over time. Furthermore, sea level at some locations is influenced by changing regional sea surface temperature patterns, such as tropical locations where sea level is affected by El Niño and La Niña related patterns.
The plots provided in this post come from the Sealevel website and have seasonal fluctuations removed. I looked for measurement locations with continuous or nearly continuous 100-year or longer periods of record extending to the present. Then I checked for locations with recently stable vertical land motion. Locations with stable vertical land motion are most likely to better represent absolute coastal sea level change. Stations where the land is rising or falling are measuring relative sea level change and the vertical land motion must be considered to estimate the absolute sea level change. I found 15 long-term sea level measurement sites with nearby or collocated Continuous Global Positioning System (CGPS) measurements. Sea level measurements from seven of these sites are presented below.
To estimate the vertical land motion, I looked at nearby CGPS estimates of land motion trends using the Sonel website. For some locations there were no nearby CGPS measurements available, so I disregarded those sites for this analysis. For the remaining sites, most had CGPS measurements from nearby locations that were not collocated with the sea level monitoring site, which increases uncertainty a bit. Fortunately, the site with the smallest vertical land motion has the CGPS monitor collocated with the sea level monitoring site at Honolulu, Hawaii. Measurements from this site, as displayed in Figure 1 below, indicate a sea level trend of about 1.49 +/- 0.21 millimeters per year (mm/yr) for 1905-2017. The recent CGPS land vertical motion trend for 1999-2014 was -0.23 +/- 0.18 mm/yr or practically stable considering the uncertainty. These measurements indicate a global coastal absolute sea level rise of about 15 centimeters (6 inches) over 100 years with no acceleration – certainly not alarming and no different than what has already been handled over the last 100 years.

Figure 1. Honolulu HI USA 1612340 (click to enlarge)
The graph in Figure 1 also includes a plot of ice core and Mauna Loa carbon dioxide (CO2) levels in conjunction with the sea level measurements. As can be seen, there is no indication of acceleration in the sea level rise associated with the accelerating rise of atmospheric CO2. The implication is that we are not likely to see an effect on sea level rise from increasing CO2 levels any time soon, or we already would be seeing the effect.
The site with the second most stable land motion was at Trieste, Italy where the indicated sea level rise for 1875-2016 was 1.30 +/- 0.15 mm/yr as seen in Figure 2 below, with a recent land vertical motion trend of 0.32 +/- 0.26 mm/yr. Here the CGPS site was not collocated with the sea level monitoring site and thus there may be a larger uncertainty about the land motion at the sea level monitoring site. This uncertainty is probably enough to account for the difference in the sea level rise from that measured at Honolulu. However, once again there is no indication of any significant sea level rise acceleration over the last 100 years at Trieste, despite the accelerating rise in CO2 levels.

Figure 2. Trieste Italy 270-061 (click to enlarge)
Of the remaining sites, nine had nearby or collocated CGPS measurements indicating land motion trends of -0.53 to -4.59 mm/yr (subsiding land) and four sites had land motion indicated in the range from 0.59 to 7.88 mm/yr (rising land). Figures 3, 4, and 5 show sea level trends for locations with subsiding land: San Francisco, California; New York City (The Battery), New York; and Galveston, Texas. Nearby CGPS measurements indicated vertical land motion trends of -0.84 +/- 0.18 mm/yr at San Francisco, -2.12 +/- 0.62 mm/yr at New York City, and -4.59 +/- 0.78 mm/yr at Galveston (all with subsiding land). The measured relative sea level rise rates are listed in the graphs.
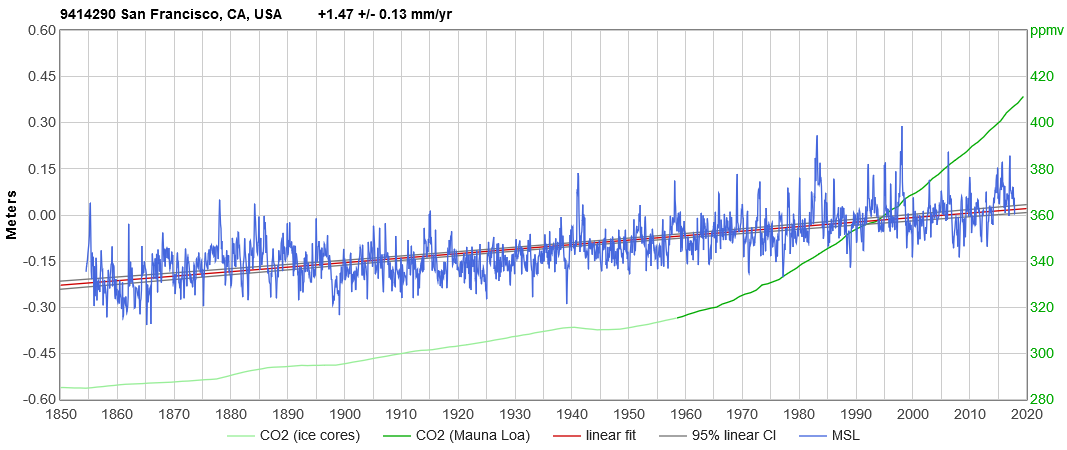
Figure 3. San Francisco CA USA 9414290 (click to enlarge)

Figure 4. The Battery NY USA 8518750 (click to enlarge)

Figure 5. Galveston TX USA 8771450 (click to enlarge)
The relative sea level measurements at two locations with CGPS indicated rising land motion are displayed in Figures 6 and 7 for Oslo, Norway and Vaasa, Finland. Nearby CGPS measurements indicated recent rising land motion of 5.33 +/- 1.12 mm/yr at Oslo and 7.88 +/- 1.14 mm/yr at Vaasa.
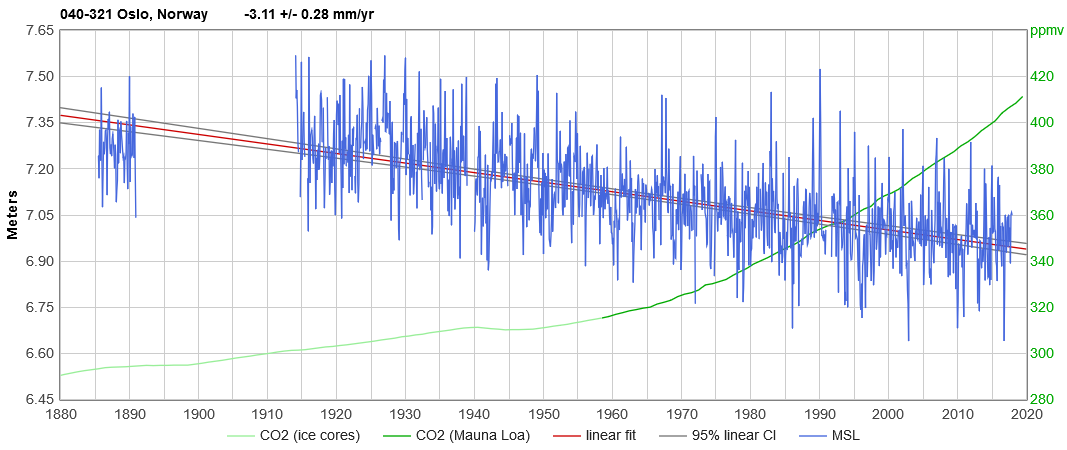
Figure 6. Oslo Norway 040-321 (click to enlarge)
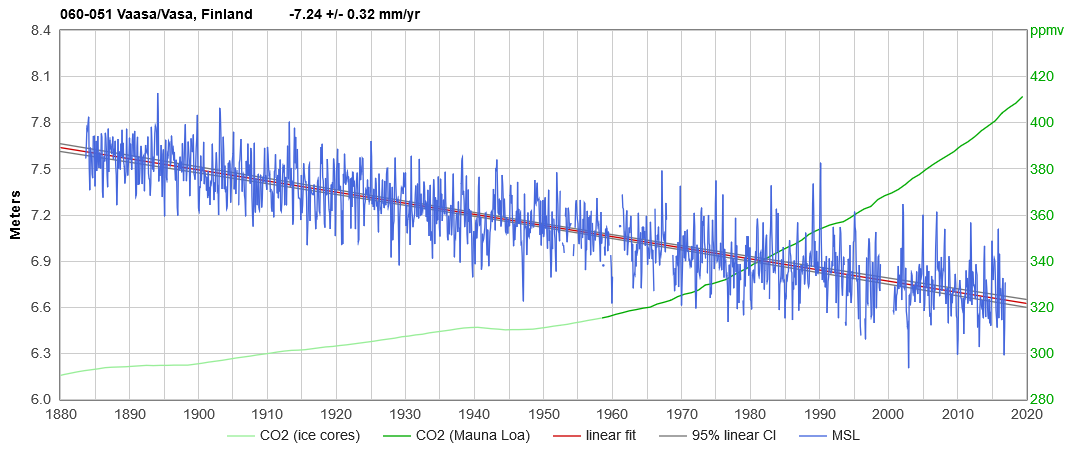
Figure 7. Vaasa Finland 060-051 (click to enlarge)
Yet again, there is no indication of accelerating sea level rise at San Francisco, New York City, or Galveston or corresponding decelerating sea level fall at Oslo and Vaasa as might be expected if accelerating atmospheric CO2 levels were having an impact. Sea level rise will be enhanced at locations where land is subsiding. Galveston is a good example, where the land is subsiding faster than the sea is rising – a bad combination. And there are many other coastal locations in the same predicament, but it’s the land subsidence that is the main problem at these locations.
Extraordinary claims require extraordinary evidence, and the evidence clearly does not support the claims. The claims of dire sea level rise in coming decades are pure speculation at best and fearmongering at worst.

Reblogged this on Climate Collections.
“if accelerating atmospheric CO2 levels were having an impact”
Why would you expect sea-level to show an instantneous correlation with CO2?
For starters there is reported to be a 10 year lag in the maximum warming effect of CO2 emission to be taken into account?
https://phys.org/news/2014-12-co2-effects-felt-decade-emitted.html
Also, might there not be some inertia to overcome, some thermal lag as that warmth works its way into ice sheets, glaciers etc.?
Whats more others have shown there is indeed an acceleration:
https://tamino.files.wordpress.com/2019/11/earthdang_rate.jpg?w=500&h=333
Lets just let our grand kids deal with it.
Thanks for your input Tony. You are right that we should not expect to see an immediate response in ocean effects from rising atmospheric CO2 levels. Also, the hypothesized atmospheric effect of CO2 on increasing surface atmospheric temperatures is logarithmic and therefore does not show as much acceleration as the raw CO2 changes. However, even the logarithmic acceleration of CO2 began around 1950, so we have had almost 70 years now to see an effect on coastal sea levels, but none is apparent so far. I can’t rule out the possibility that the ocean effect might take longer, maybe on the order of centuries, but that might also dilute the effect over time such that the increase is not very rapid and thus not catastrophic.
I’m aware that there are plenty of estimates of full-ocean (not just coastal) sea level rise that show acceleration. However, those estimates have very large uncertainties that are almost never discussed or addressed. In my view the uncertainties are too large to be able to resolve the small increases in full-ocean sea level that are occurring and therefore useless for determining an accurate assessment of sea level changes. Again, as I mentioned in my post, it is sea levels along the coasts that have a direct impact on human activities and interests. What happens in the middle of the ocean is of scientific interest, but seems to be having little bearing on what is happening along global coastlines. So I am not worried about causing climate problems for future generations.
Also, looking at possible future impacts of increasing CO2, from what I have read even conservative estimates of future global CO2 emissions show a continued rise in global total CO2 emissions, despite optimistic expectations of greatly increased energy production from wind/solar/battery sources. Consequently, it appears very unlikely that global total CO2 emissions will be declining any time within the next few decades. Thus, if you “believe” in the man-made fossil fuel related “climate crisis”, we are all doomed.
Fortunately, in my view, our best science does not support such doom and gloom about future climate change over coming decades. My concern is more about when the next “little ice age” may hit, which could have very devastating effects sometime in the next few centuries. Likewise, over coming millennia, sooner or later earth will plunge into the next glacial cycle in the current ice age and that will cause HUGE impacts on humanity if not averted. Perhaps we should hope that increasing CO2 levels might delay the onset of this major catastrophe, although I doubt it will have enough impact to avert the next glacial maximum.
Actually Tamino has , with his usual rigor, has recently addressed the acceleration of sea level rise and associated uncertainties at the following-
and
and again at
and also
and yet again at
https://tamino.wordpress.com/2019/11/08/sea-level-gridded-average/ .
Interested to get your opinion.
MikeR,

Thanks for the links. I took a quick look at all of them. The plot that stands out to me is this composite of several independent assessments of coastal sea level measurements:
This composite indicates some of the uncertainty associated with trying to composite data from many sites, including many sites that have significant upward and/or downward land motion. That uncertainty also makes any analysis of trends and or acceleration more uncertain and so far I have not seen assessments of the uncertainties for these composites.
I chose to focus on sites that have minimal recent vertical land motion and also have long sea level measurement records. I only found two as I reported. Ideally it would be nice to have longer term vertical land motion data, but I’m not aware of any. Consequently, that still leaves some uncertainty about the vertical land motion over most of the period for those two sites (and all the others as well). However, the consistent long-term linear trends at all of the seven sites presented, as well as the other eight sites I did not include suggest that long-term vertical land motion trends are relatively stable, at least at the 15 locations I examined.
I also think it’s better to use sites with long-term records because all sites exhibit quite a bit of shorter term fluctuation that makes it difficult to have confidence in trend assessments with even 50 to 70 years of data as I have seen used in many analyses and some analyses use even less.
I have now found several recent studies that all indicate subsidence in Galveston County, especially close to the Gulf of Mexico, has all but stopped because oil depletion has significantly limited oil extraction in the area and the strict regulation of water mining starting as early as 1970.
JCH,
I revisited the SONEL data from the three CGPS monitors near the Galveston tide gauge, which unfortunately are somewhat contradictory and only one is still in operation (TXGA at 2.9 km away from the tide gauge) and it had a rather large discontinuity in 2011 attributed to “material change or malfunction”. The TXGA CGPS data are only displayed to 2014 for the ULR analysis. However, if you click the button for the “NGL” analysis it displays data to 2019 and shows a sudden jump in early 2017 to back in line with the pre-2011 data. It still shows continued subsidence into 2019 with little change in trend if you correct the offset period raising it up by the listed offset amount.
https://www.sonel.org/?page=gps&idStation=2973
In looking around the SONEL site to find more information about CGPS calculations and related uncertainty I found this statement:
“The processing of GPS observations is particularly complex for the calculation of vertical movements of the land on which the tide gauges are placed (movements of the order of mm/year). The article published in 2007 by the members of the consortium of the ‘ULR’ GPS analysis centre describes the difficulties and the challenges raised by this issue. The figure opposite illustrates the challenges : shown on the left is a series of average sea levels measured with tide gauges ; in the middle the series are corrected with the predictions of the de postglacial rebound model ICE5G (VM2); on the right with the GPS velocities obtained by the ‘ULR’ centre in ITRF2008.”
And associated graph which includes Galveston:
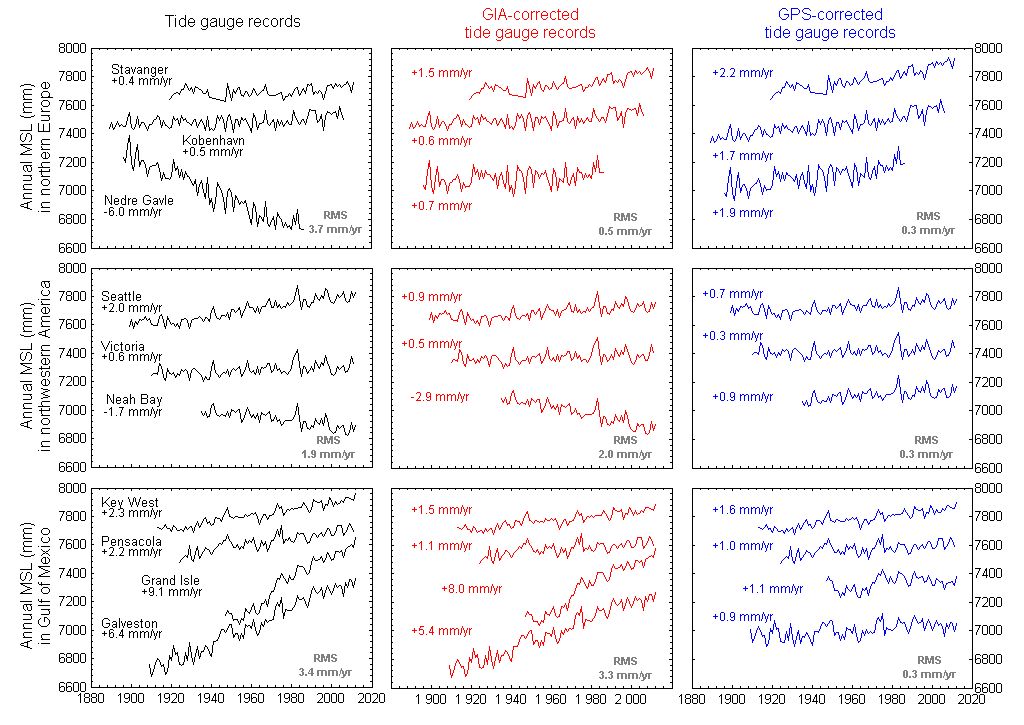
This graph shows a GPS-corrected SLR of only 0.9 mm/yr for Galveston with RMS 0.3 mm/yr. As you can see, there is still quite a wide range in the GPS-corrected SLR among the ten tide gauge measurement locations they present, including four in the Gulf of Mexico, three in the NW US and three in northern Europe. I interpret that variability to likely be from GPS measurement uncertainties, especially in extrapolating the short CGPS trend over the much longer SLR trends.
I’m no good at cartoons but here is a verbal one:
Picture a rail station with delapidate cobwebs strewn passengers waiting for the train. An announcement over the tannoy:
The 2100 Tipping Point Express due to arrive at platform 2008 has been further delayed due to the wrong kind of CO2 contaminating the rails. An update announcement will be made in 2020.
You do not have to hope. The next LIA is already completely averted for a lot of centuries.
JCH,
“The next LIA is already completely averted for a lot of centuries.”
You’re more optimistic than I am in that regard. I will certainly hope you are right, but I will certainly not live long enough to find out. 🙂
It makes a good boogeyman. All modeling of an AMOC shutdown I have seen indicates no LIA is in the cards. Other than that an AMOC shutdown, what would cause it?
JCH,
From what I recall reading, historians and geologists generally refer to past warm periods as “optimum”, such as the Holocene Optimum or even the much warmer “Eocene Optimum”. And they also describe flourishing civilization in warm periods like the “Roman Warm Period” when the Roman Empire expanded and the “Medieval Warm Period” when Vikings were able to grow oats in Greenland (which is no longer possible). Whereas cold periods are labeled the “Dark Ages” when the Roman Empire declined possibly influenced by colder temperatures and the “Little Ice Age” when crop failures and famines were common, at least in Europe. Maybe someday historians will call our current time the “Industrial Warm Period”? It is certainly coincident with generally improving conditions for most of humanity. If and more likely when there is another cooling period, it will likely be associated with problems for humanity, AKA a definite “boogeyman” situation.
Harris County, which includes greater Houston, has major, ongoing subsidence. What I have read is Galveston County stopped groundwater mining decades ago and that subsidence there, old part of the city, has largely stopped, which I believe is where that gauge is located: close to the offshore petroleum museum. Starting just after 1900, major infrastructure changes have happened in the city, including raising the ground level of the city and a seawall. Whether any of that matters or not, I can’t say.
JCH,
Thanks for the info about Galveston. I’m a “native” Texan and I’ve been to Houston and Galveston many times over the years. I’ve also read about terrible subsidence on the west side of Baytown in the past. If the subsidence was lessening at the Galveston tide gauge, I would expect to see a gradual decrease in the sea level rise at the more recent end of the graph. But I don’t see such a decrease, so I am doubtful that the subsidence has ended yet, at least not at the tide gauge site.
Unless, of course, the lessening of subsidence on the island is being offset by around a 3.3 mm/yr rise in sea level?
Years ago, I think starting in 1995, the powers that be in Houston convinced the state legislature to establish 3 subsidence districts in Harris and surrounding counties. So they had statutory objectives that had to be met. Galveston County was the most aggressive.
There are lots of recent studies on Google Scholar, some by local scientists, about Houston area subsidence and SLR.
Also, I think each tide gauge is its own scientific studies. Absent that, they’re very poor indicators of the actual rate of SLR.
JCH,
If the absolute sea level rise was accelerating or decelerating it would show up at all the sites and it does not. This evidence implies that the Galveston tide gauge site is still sinking at about the same rate as over the entire period of record. And yes, without looking at the local land motion, data from individual tide gauges are difficult to assess for implications about absolute sea level rise (larger uncertainties). In this study I did look at the local land motion, but did not attempt to apply it to locations where the land motions were relatively large, mainly because of uncertainties associated with the CGPS monitors not being collocated with the tide gauges in most cases.
An extensive discussion of the Gulf of Mexico:
Anthropocene Sea Level Change: A History of Recent Trends Observed in the U.S. East, Gulf, and West Coast Regions
JCH,
Thanks for the link. I took a quick glance and it’s an interesting study, although I disagree with some of the methodology and conclusions. I won’t have time to look at it in detail in the near future but should be able to take a more thorough look at it next week. I will compare some of their graphs to those at Sealevel.info to see how well they match.
What rapid rise?
“an underlying sea level trend that remains at all stationary in the presence of rapidly rising tropospheric temperatures and ocean heat content from the mid-twentieth century onward (right side of Fig. I-1) is hardly immune to challenge.”
Looking forward to your analysis.
OZ4 – I believe this was just presented at AGU:
https://www.essoar.org/doi/pdf/10.1002/essoar.10501987.1
JCH, thanks. An interesting study, but it doesn’t say much about acceleration or deceleration of the subsidence rates in Southeast Texas. It does show quite a bit of variability in subsidence rates over short distances, although the site baseline periods vary quite a bit as well, confounding the situation.
Surely you should be comparing sea level rises to ice loss rates. That’s the relevant correlation to check, not temperature.
diogeneshaircut, sea level rise is driven by complicated factors that are fraught with uncertainty. Those factors are in part influenced by temperature and include not only land ice/snow, but also land surface and ground water. Sea ice does not affect sea level. In my view, the uncertainties are too large to be able to make a meaningful assessment, although many have tried (but rarely mention the large uncertainties).